Log Services
Once your developed APIs are live, they can be integrated into your apps. Once your client application is built and in use, you will need a deeper diagnostic tool to analyse any runtime issues with your services. Sometime you may encounter sudden outages in sections of your application. There can be any reason such as a service is no longer working as expected, or you run into issues after updating your device to a new OS version. This becomes a difficult situation to debug, and for live apps, it's critical to resolve such problems as quickly as possible.
Kony Log Server
Kony Log server was designed to help you solve this very problem. This tool provides granular log level control and the ability to view logs in real-time. Using Kony Log server, you will be able to view all application and service issues in one place, making it easy to analyze the root cause of your problem. The tool also lets you quickly filter out logs to quickly triangulate the piece causing the problem. The log services console is accessible from the Environments tab in Kony Fabric console. There is a host of features available in the portal to help you quickly debug your issue.
More on that below!
The Log Services portal displays three main features - Discover, Visualize, and Dashboard.
Important: To get access to Kony Log Server, contact your Sales representative.
- Discover: You can Search logs by providing a keyword or customizing the available filters to view your desired logs.
- Visualize: You can Visualize your filtered logs into predefined chart forms. We provide easy, predefined charts for you to choose from.
- Dashboard: Arrange your visualizations into a dashboard for daily updates.
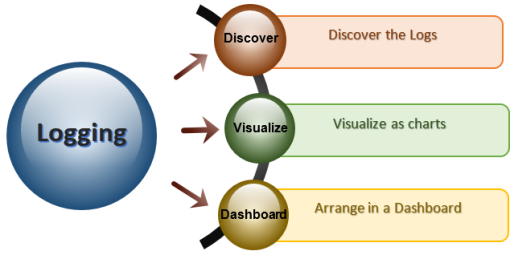
To access Log Services follow the below steps:
- Log on to Kony Fabric Console. For more information on accessing Kony Fabric Console, refer to Accessing Kony Fabric Cloud.
- After successful login, click Environments/Clouds from the left pane on the page. In this section, you can view all the consoles displayed for the registered cloud account.
- From the list of consoles displayed, click Logging Services.
As discussed in the previous sections of this course, the log services module includes the following three sections:
- Discover
- Visualize
- Dashboard
Let's look into each of these items in a bit more detail.
Discover
As the name suggests, the section lets you discover logs generated by Integration and Storage services. All the service requests made by your account will be shown in this section. You can use some suggested filters, such as status:200, or simply enter the search criteria in the provided search fields to find your required logs.
You can also modify your query to retrieve log data for different time periods using the time filter provided on the upper right corner of the screen. By default, the system displays the logs captured in the last 15 minutes of the current day. You can also enter a keyword in the search field to find log data of services containing your keyword. The right pane displays filters to refine the displayed search results.
Tracking an Error in your application
Having your live application malfunctioning is every app developer's nightmare. In this section, we will show you how to pick out your error logs from the entire application's log data. Let us continue with the scenario of the online bookstore described in the previous section.
In the previous section, while looking at the Test from Console option, we received an error message from the server, when we sent parameters in an incorrect input format.
Now, let us view the error logs that were generated in the Log server while testing the service for the same scenario - Retrieving the list of books available in the inventory based on the published date.
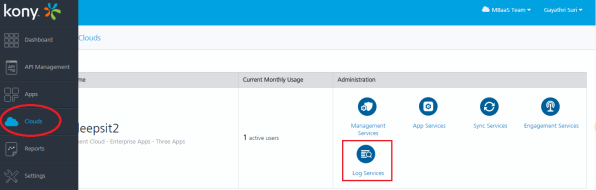
Here is a refresher - Our primary test parameter was the published date; if the date format provided is incorrect, the system displays an error. Using the Log Services module, we should be able to track and analyze this error quickly.
By providing a search parameter in the Search bar, you can track the error logs, which were generated while testing the service for the bookstore. In this example, let us use the key parameter as ERROR. Notice that it enables the system to display all results that fulfill the criteria as displayed below.
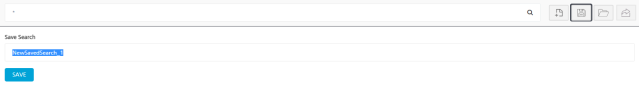
You can also save your search filter by clicking the Save Search option. Saving the search filter is an efficient way to access your results quickly in the future.
Visualize
You can visually illustrate relevant information by using several types of visual statistic charts. Visualization provides you options to design different charts for the different log scenarios.
You can either perform a new search or use your saved search to create visualizations.
To create an Visualization chart, perform the following steps in the Log Server console:
- Click on the Visualization tab. The list of available charts appears.
- Choose a chart type from the Create Visualization page.
- Select a search source from a Saved Search, or create a new Search criteria.
As in our user scenario, we will select our saved search to tracks error logs that were generated while testing the bookstore service.
To track error logs, follow these steps:
- The system displays the visualization based on the search parameters you have provided.
- Make the required changes by using the filters provided in the left pane.
- Click Save Visualization to save the visualization.
Let us walk thru a few of the visualization options available
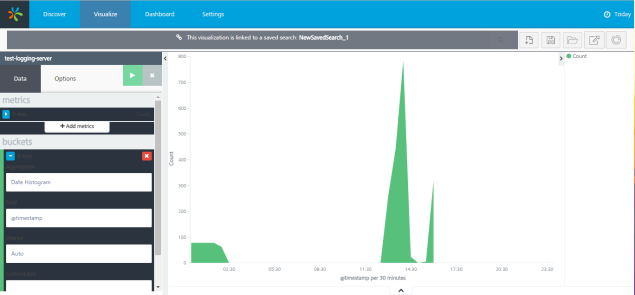
Area Chart
You can create an area chart to display stacked timelines. This graph shows the times when an ERROR message was encountered.
Similarly, we can prepare more charts with the same data.
Line Chart
You can use line charts for high-density time series.
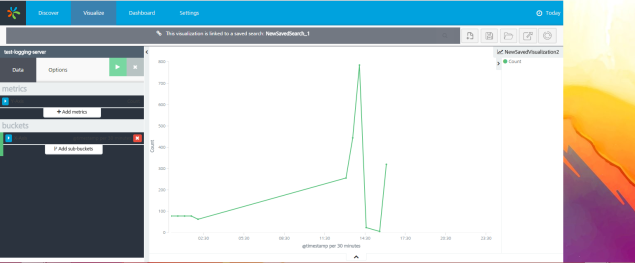
You should choose the Chart that best represents your data.
Dashboard
For a one-stop view of all your important log data, you can represent the charts created in the Visualization tab in a dashboard.
Based on the error log data, we have created three types of charts. Now, let us select the three saved visualizations and create a dashboard for our scenario.
To access and create a dashboard in Log Services, follow these steps:
- Click the Dashboard tab.
- Click the + icon on the screen, or click the Add Visualization button at the upper right corner to add the saved visualizations to the dashboard. You can use the Add Visualization button to add any number of visualizations to the dashboard. We have created three different visualizations to represent the same log data, and added them in our Dashboard.
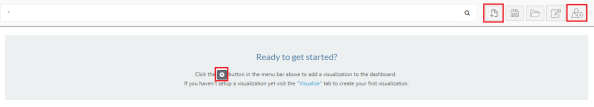
Here is what my dashboard looks like now :
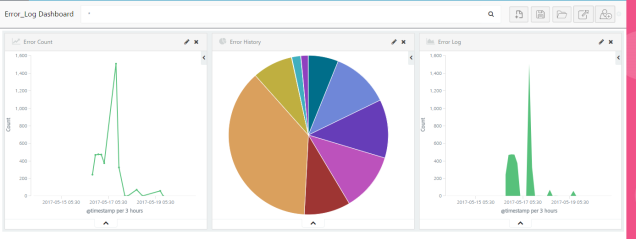
You can even edit or delete visualizations from the dashboard. Click Save to save the created dashboard.
| Copyright © 2015 Kony, Inc. All rights reserved. |